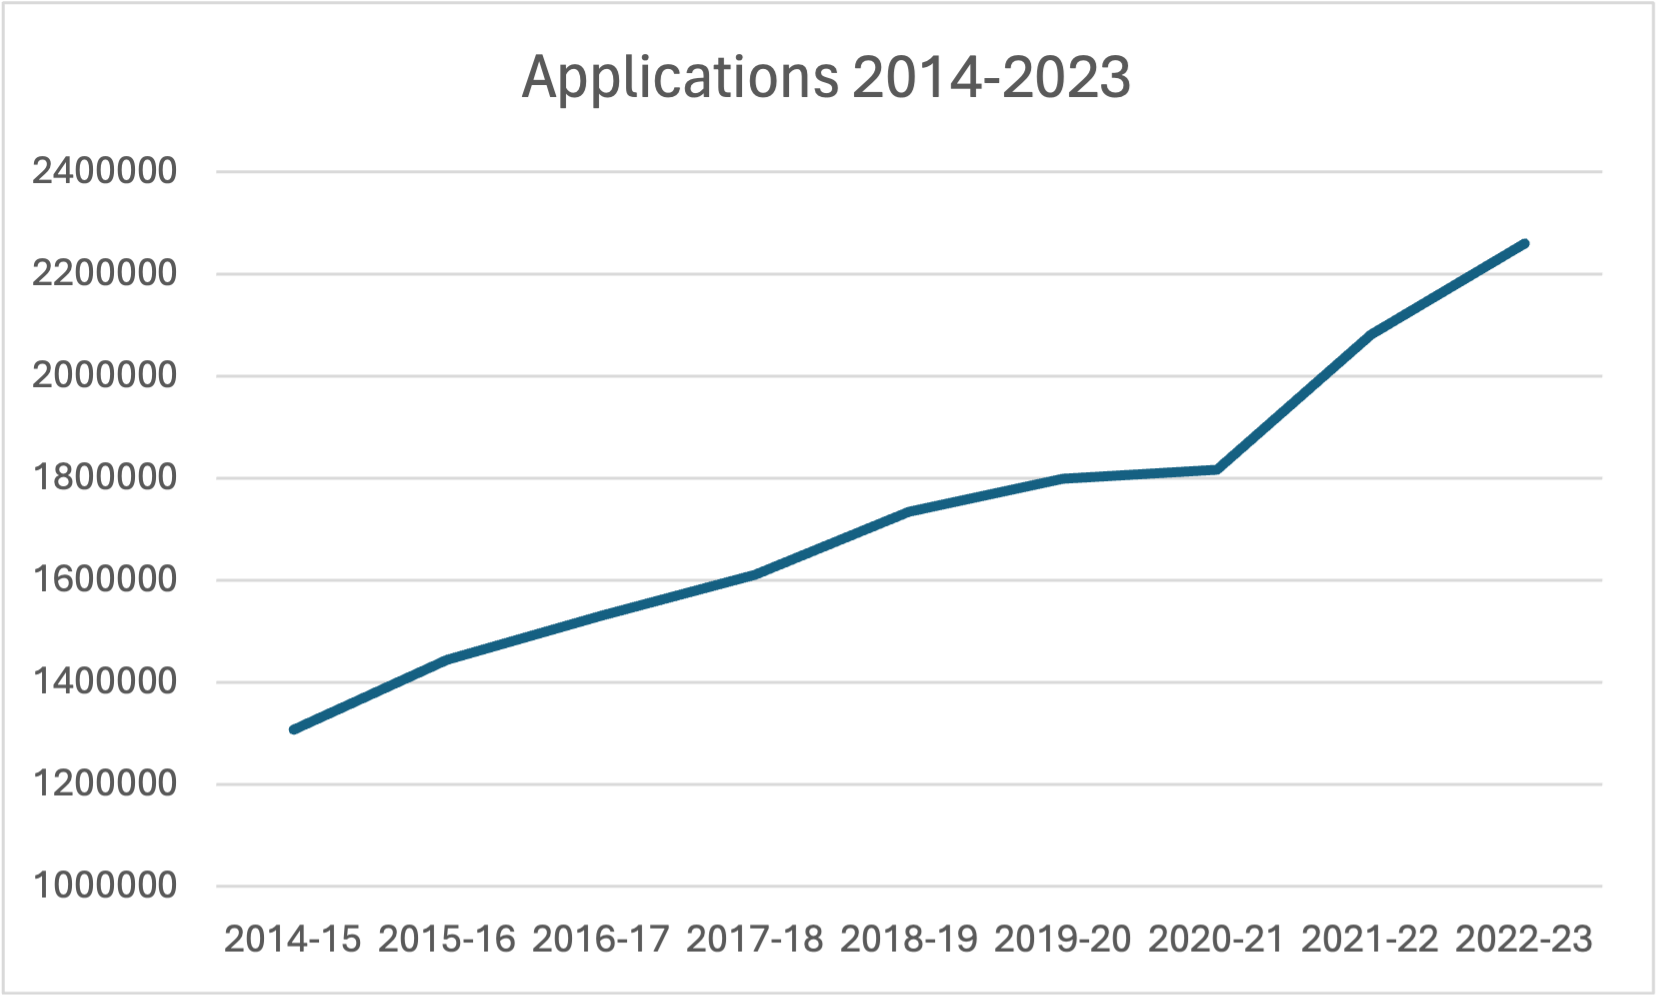
The number of applications to the most rejective American universities has been growing for the last 20 years. Interestingly, the number of Americans going to university is reaching a demographic peak, but the number of applications has been growing as students apply to more universities, and more students from abroad also apply - many of whom might not necessarily enrol.
Universities will never tell a student not to apply. The more applications received, the lower the admit rate, and the lower the admit rate, the higher ranked a school will be. These silly, subjective, flawed rankings have led to an arms race of sorts where universities seek applications from around the globe to "keep up" with the school down the road that is doing the same.
Covid resulted in universities largely adopting a "Test Optional" policy as they couldn't realistically ask for a test that students couldn't take. This led to many students applying to MORE schools than before, including those that they probably have zero chance of getting into. Test scores used to act as a rough filter of sorts to reduce frivolous applications, but if the test is "optional" then why not send in an application from a straight A student? (A majority of students at many schools are "straight A students" now...)
This accelerated the growth in application numbers further with those to the most popular schools surging upwards of 20% from 2020 to 2023. The number of places has been fixed so the result is even lower admit numbers as the number of applications to schools like NYU have more than doubled in 10 years. All the while, as previously reported, the majority of those that get into said schools are submitting SAT scores. Test "optional" is actually test "preferred".
Switching away from test optional would result in a sudden dip in the number of applications received, a rise in the admit rate, and a fall in the rankings. Only a select few schools have been brave enough to adjust their policy to reflect the reality on the ground - Cornell being the latest on April 22nd. We expect more to follow, but it is a collective action problem with universities effectively side-eyeing their peers. It is too late now for any other changes for this coming 2024-2025 admissions cycle, but more schools are sure to follow. Perversely, some schools might follow as doing so would group them with the very rejective schools that have already done so and perhaps help with application numbers!
An excerpt from our related research drawn from university Common Data Sets with charts and graphs can be found below.
We will be mining this data for more thoughts in the future. For now, please look at schools outside of some arbitrary ranking table or those that are "popular" at your school - only about 75 schools in America are actually hard to get into!
Testing Trends
We have been mining the Common Data Sets of publicly available information from the most popular 40 or so universities in America. The trend pre-Covid was towards a concentration of applications towards perceived quality with a direct result in lower admissions rates as the size of entering classes has remained largely static.
Covid led to nearly all schools adopting a “Test Optional” policy that had the unintended side effect of greatly accelerating this trend.

This is best seen when we aggregate all the categories of universities.
The large private schools haver enjoyed a particularly large jump in applications with Northeastern and NYU more than doubling in just 10 years.

And of course the number of applications to schools in a specific regional athletic conference also has continued to grow.

With admit rates trending towards historical lows.

The University of California system is one of the few to reveal what the admit rate is overall and also for international students and the differences for Berkeley and UCLA are stark. A good number of the international kids are athletic recruits…

This has been the case across the board with more applications submitted across all the most popular schools. As a result of the test optional policies, many students who might not really have much of a chance of gaining admissions are having a punt and just submitting their applications with no test scores.

Students withholding scores also has accelerated the increase in average SAT scores among admitted students.

While all the while, the overwhelming majority of successful applicants are indeed submitting test scores:
By admit % Submit Rate Admit rate
Top 20 69.6% 6.5%
Top 40 62.7% 9.3%
Top 60 61.3% 12.8%
Top 100 57.8% 23.4%
Top 150 55.4% 35.7%
Top 200 54.3% 47.5%
We group the schools as follows:
Small-mid Privates
Caltech
CMU
Duke
Emory
Georgetown
MIT
Northwestern
Stanford
Tufts
Vanderbuilt
Wash U - St.L
Publics
UC Boulder
Georgia Tech
UIUC
Purdue
UC Berk
UC Davis
UC Irvine
UCLA
UCSB
UCSC
UCSD
Michigan
UTA
UVA
Large Privates
BC
BU
GWU
Notre Dame
Northeastern
NYU
Tulane
USC
The Test is Meant to be Hard
There has been some chatter that the SAT a few weeks back was very difficult.
This is the first time the new test went "large" and was administered in the States as well as international. By tweaking the questions a bit harder, College Board has a bit more room to play with at the top of the curve, in order to keep the scoring comparable to past tests - a core objective of any metric. If the test is objectively hard then it will be scored on a more lenient scoring table. A bit like a handicap/slope rating of a golf course.
If the test was really easy then loads of kids would have had full marks on the math and you can't have 10% of the kids get a perfect 800. The test being "hard" is kind of the point - if most kids got 90% correct you would end up with a terrible metric, akin to an inflated GPA. While the scoring on the new test is indeed a bit of a black box, the headline scores will be statistically massaged to be directly comparable with past iterations. Even last year the complaint was that the test seemed harder than the practice tests but most scores came in as expected.
For any of our many students who sat this test, let us know how you did when the scores come out.
Is this the end of "Test Optional"?
On February 5th Dartmouth announced that it will be re-instating the SAT/ACT requirement for domestic applicants. Less than 3 weeks later Yale followed suit with a rather confusing "test flexible" policy. These moves surprised few and had been telegraphed well in advance. Yale even has a miniseries of podcasts cued up detailing the rationale behind the move.
Both schools cite internal studies that showed that the test optional policy was discouraging economically disadvantaged students from submitting scores that would have potentially helped them gain admission, even if the scores were lower than 25th to 75th percentile scores of accepted students. They were at pains to say that all scores are considered in the context of the student's situation and hence a 1350 from a kid from a rough urban school would be potentially seen as demonstrating even more academic potential than a a student with a 1500 from Greenwich Connecticut. Further, both studies also showed that test scores have been a better predictor of academic success than grades, surprising few who have noted the gross grade inflation now prevalent.
As we've written about previously, "test optional" for the most competitive schools has proven to be a bit of a facade. Well over 60% of accepted students in the most "rejective" 40 American universities with a test optional policy submitted SAT scores. These moves by Dartmouth and Yale simply said the quiet part out loud: universities want to see as much data on applications as possible and test scores are a useful metric, in combination with the many other factors considered.
Other schools have "reaffirmed" their commitment to sticking with test optional moving forward. 78% of successful applicants to University of Michigan submit scores, as do 69% of applicants to Columbia. How could something that a large majority do be considered optional? Great grades, sports, music, and great school activities are also technically "optional", are they not?
Speculation is rife on which schools may soon follow. Harvard (83% submitting) has remained test optional, but what about Brown (81%), Duke (93%), or U Chicago (84%)? While these schools represent an insanely small percentage of students in America, they tend to take the lead and others follow.
Students that do well in school and who would excel at a top university will do well on the SAT, even better with a bit of help.
Common Data Set
We've spent a fair number of hours scraping data off common data sets. These are standardized data submissions that most universities post yearly. A good directory can be found here. These files contain a host of data on enrolment, applications, and retention but we chose to pluck out three key numbers:
- Admit rate (percent of completed applicants accepted)
- SAT/ACT submission rate (percent of enrolled students who submitted standardized test scores)
- Yield percentage (percent of admitted students who enrolled)
We compiled this data from over 200 American universities using the US News rankings as a point of departure for selection. For this month we will be looking at admit rates and submission rates. To keep the data as clean as possible, we have stripped out schools that are test blind (UCs) and also those that are test required (MIT, Georgia/Florida publics, Georgetown, service academies). We have also not included schools that didn't include testing data (ahem, Dartmouth et. al.).
By admit % Submit Rate Admit rate
Top 20 69.6% 6.5%
Top 40 62.7% 9.3%
Top 60 61.3% 12.8%
Top 100 57.8% 23.4%
Top 150 55.4% 35.7%
Top 200 54.3% 47.5%
Over half of the enrolled student in the 200 most rejective American universities submitted test scores, nearly 70% to the top 20.
By admit % Submit Rate Admit rate
1 to 20 69.6% 6.5%
21 to 40 55.9% 12.0%
41 to 60 58.5% 19.9%
61 to 100 52.7% 39.8%
101 to 150 50.3% 60.0%
151 to 200 51.1% 82.6%
Segmented by group, the number is still well north of 50%. So among all enrolled students in schools from number 41 (Wesleyan U) to 60 (Scripps), 58.5% submitted test scores and the average admit rate among those schools was about 20%.
How is something that over half of people do really "optional"? Seems that a better word might be "preferred".
We'll be doing some analysis on yield and also on how these numbers differ among large publics, privates, and smaller colleges in the months to come.