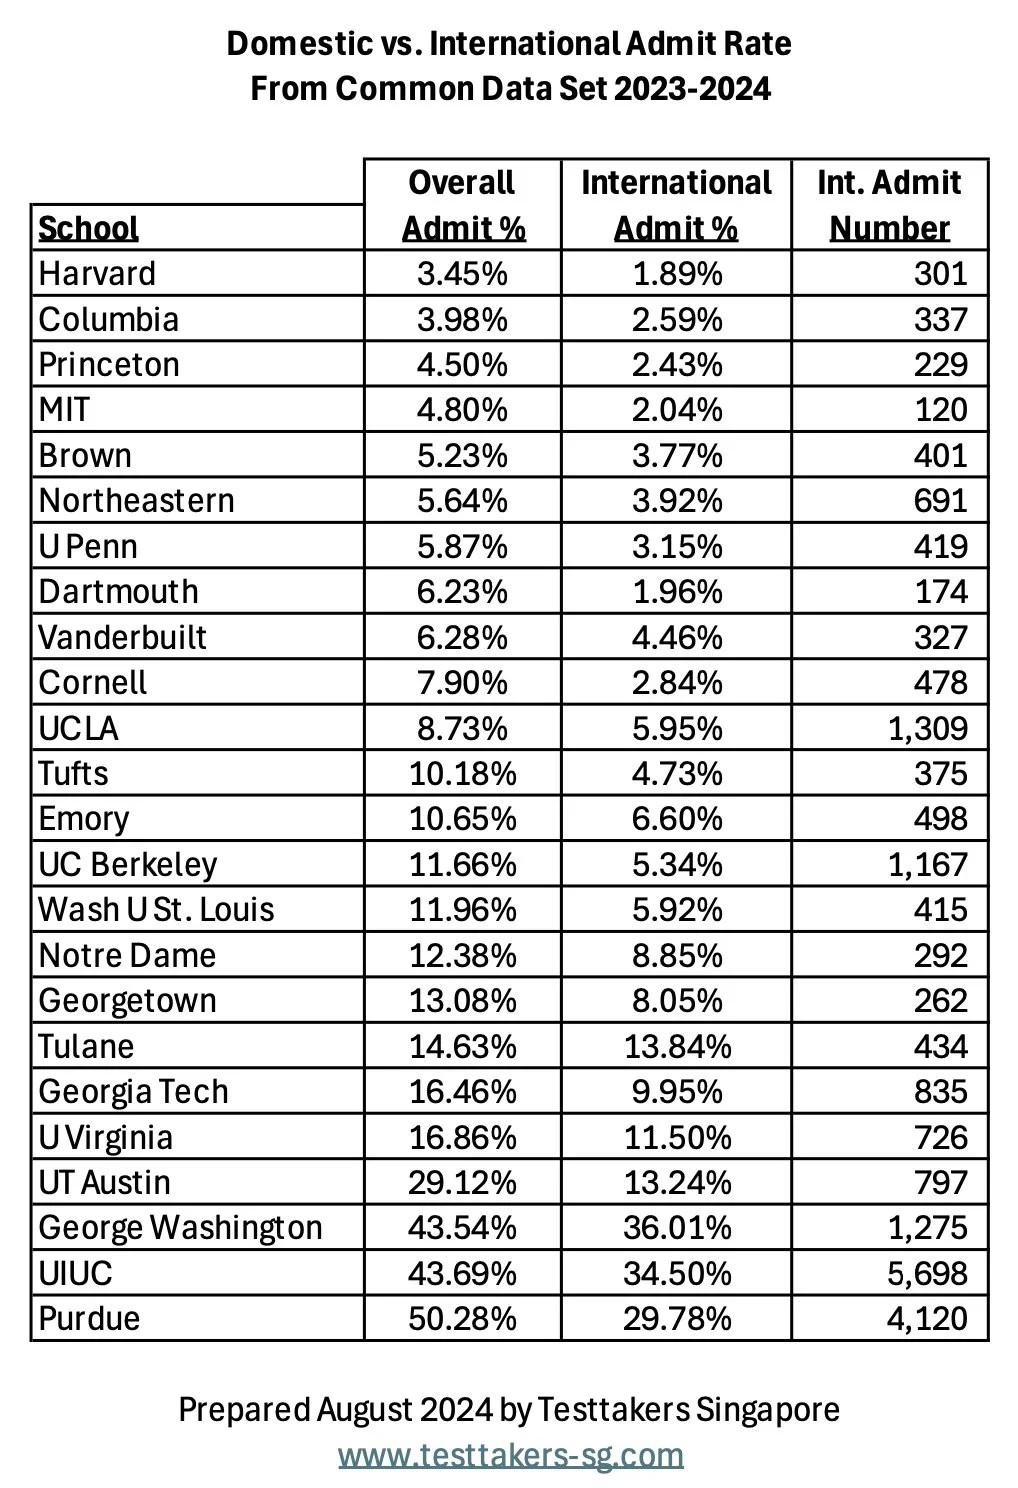
As admissions to a select few American universities gets more and more competitive, there seems to be a new company popping up every week that claims to have “cracked” the admissions puzzle. These companies have lovely websites and will happily take your money. However, there is simply no “secret sauce”. Admissions is a holistic process with different universities prioritizing different things. At the most competitive it really now comes down to a lottery of sorts, in particular for international students with admit rates often less than half the overall rate. Ethical Independent Education Counsellors (IEC) can indeed add value, particularly for students without full support in their school. Vet providers carefully and any that DON’T have at least 10 years experience working directly in admissions either at the university or high school side should not be considered. Any providers should also be members of the relevant professional organizations (IACAC & IECA).
The summer months represent a prized sales target for the less-ethical IECs as increasingly parents (and some reluctant students) feel the need to fill these otherwise fallow months with activities. FOMO reigns with a bewildering array of options that purport to help craft the perfect applicant. Here we will comment on a few of the more popular options, with a few ideas that you might have not considered.
Summer Residential Programs at Universities/High Schools
These serve to effectively monetize lovely campuses and also provide a real taste of “university life”, often allowing students to live without their parents for the first time. These programs range in quality, those run by the actual universities are generally better. Some have competitive applications and that is generally a good sign. With a few exceptions, attending a summer program at university X will not help with applications to the same university. Residential programs provide a good platform for touring other universities in the region, a great idea. Note that much of the UK and America is absolutely lovely in the summer months weather-wise, but January and February are entirely different matters.
Study and Service Trips Abroad
There are now many options for summer study abroad for high school students. Some are just fun summer camps in interesting cities, so be sure to actually get something of the experience by making progress in learning the language. For "service trips", is there really anything a 16 year old could do to actually help people in person? Set up a charity, raise money, then send the money to a trusted and experienced charity in that country.
Summer AP Classes
The AP tests are only administered in May. Formally studying for these tests over the summer is sheer folly as all will be forgotten come May. Bad idea. Do something else, anything else. Universities advise doing other more meaningful activities rather than collecting test results.
Internships
There is an industry that has sprung up securing “internships” at big name companies. These are obviously contrived, and universities know this. Paying a third party for arranging this sort of thing is entirely unnecessary. Students should be able to draw on their (parents') network to find a company that needs some cheap (or free) labor. Interning at a law firm/freight forwarder/real estate company/etc. for 2-3 months making copies, doing data entry, fetching coffee, etc. could be an invaluable experience that would provide good fodder for an application essay.
Academic Research/NGOs/Passion Project
There is a similar industry promising access to top academic mentors to pursue research projects or to help curate a “passion project”, complete with a slick website and AI-generated photos. There are avenues for independent study within most existing high school curricula, and most likely 17 year olds aren’t really able to meaningfully expand the corpus of knowledge in a given field. Such kids are probably already at a top university. If you really have a passionate interest in something, there is no shortage of online university-level courses that are largely open enrollment and relatively inexpensive or even free. Completing such courses may or may not result in academic credit, but they would demonstrate intellectual curiosity more than any standardized test result. This is something that many universities cite as a key attribute and is hard to prove clearly. Taking a online course on Japanese Literature would certainly help.
Real Job
Depending on your visa/residency situation, getting a proper summer job could be a great idea. This will help students learn about responsibility, money management, punctuality, scheduling, and interpersonal skills. There is no stigma in spending a summer making burgers at McDonalds or as grounds crew at a golf course (two summers the author looks back fondly at). See above on providing ideas for university essays.
Academic Preparation
Students should know exactly which classes they will be taking next school year and might even know their future teacher. Why not ask for an early copy of the course syllabus and start knocking out the first few units? All the major curricula now are fairly standardized and there is a wealth of online (free) resources to help kids steal a march and start the new school year ahead of the game. This could also include standardized test preparation, but please do other things as well (see above).
Have a break
School is stressful and it probably won’t get any easier until students reach university. Use the summer to refresh and recharge, play sports, learn to cook, go on walks, binge watch TV shows, study Latin, spend time with friends and family, and leave your phone alone. Here is a great list of good books to read, never a bad idea.
We hope all have a great summer break and we’ll see you in July!
- Testtakers Singapore
Note the very recent counselor newsletter from Duke University hits many of these same points, see below:
Summer Experiences: Myth vs. Reality
Are your students asking how they can best spend their time in the summer? Summer can be a great time for students to take advantage of free time and broaden their skill set. We are frequently asked by counselors and students about what the “perfect” summer schedule looks like to an admissions officer. To help you navigate these conversations, here are some common myths and our true views of various summer experiences.
Myth #1: Attending a prestigious or university-based summer program gives students an admissions edge.
The Reality: While university-hosted programs (including Duke pre-college camps) offer fantastic academic enrichment and a taste of campus life, attending one does not grant an advantage in our selection process. We review applications contextually and understand that high-cost programs are not accessible to all families. We look at what a student has gained from the experience.
Myth #2: Students need a formal research or lab internship to stand out in a STEM-related field.
The Reality: Securing a spot in a university research lab as a high school student can be a reflection of a student’s network rather than their merit. If a student lands one, that is great; but if they don’t, it will not hurt them in our process. We value self-directed curiosity. A student who spends their summer independently learning a coding language, or researching a local environmental issue, can show just as much intellectual spark as a formal research or lab internship
Myth #3: International “voluntourism” trips look impressive on a resume.
The Reality: High-cost, short-term international service trips can come across as performative rather than deeply impactful. We are often more impressed with sustained, localized impact. How is the student improving their community? Again, we are more focused on what a student has gained and how they plan to use that to impact the community around them.
Myth #4: Standard summer jobs are “wasted” time.
The Reality: Quite the opposite! We love it when students share their summer job experiences! Working teaches accountability, time management, teamwork, and conflict resolution. For students who work to support their families and/or save for college, that context is incredibly important for admissions officers to understand. For others, it may showcase their willingness to step outside their comfort zone and gain real-world experience. Encourage students to highlight these roles.
The bottom line? There is no single “correct” way to spend time in the summer. No matter what students choose to do, we want to see engagement, growth, and authenticity.